
Shiny portfolio
I will use this post as repository of all the publicly available shiny dashboards I have developed through time.
Online Interest Rate Swap Monitor
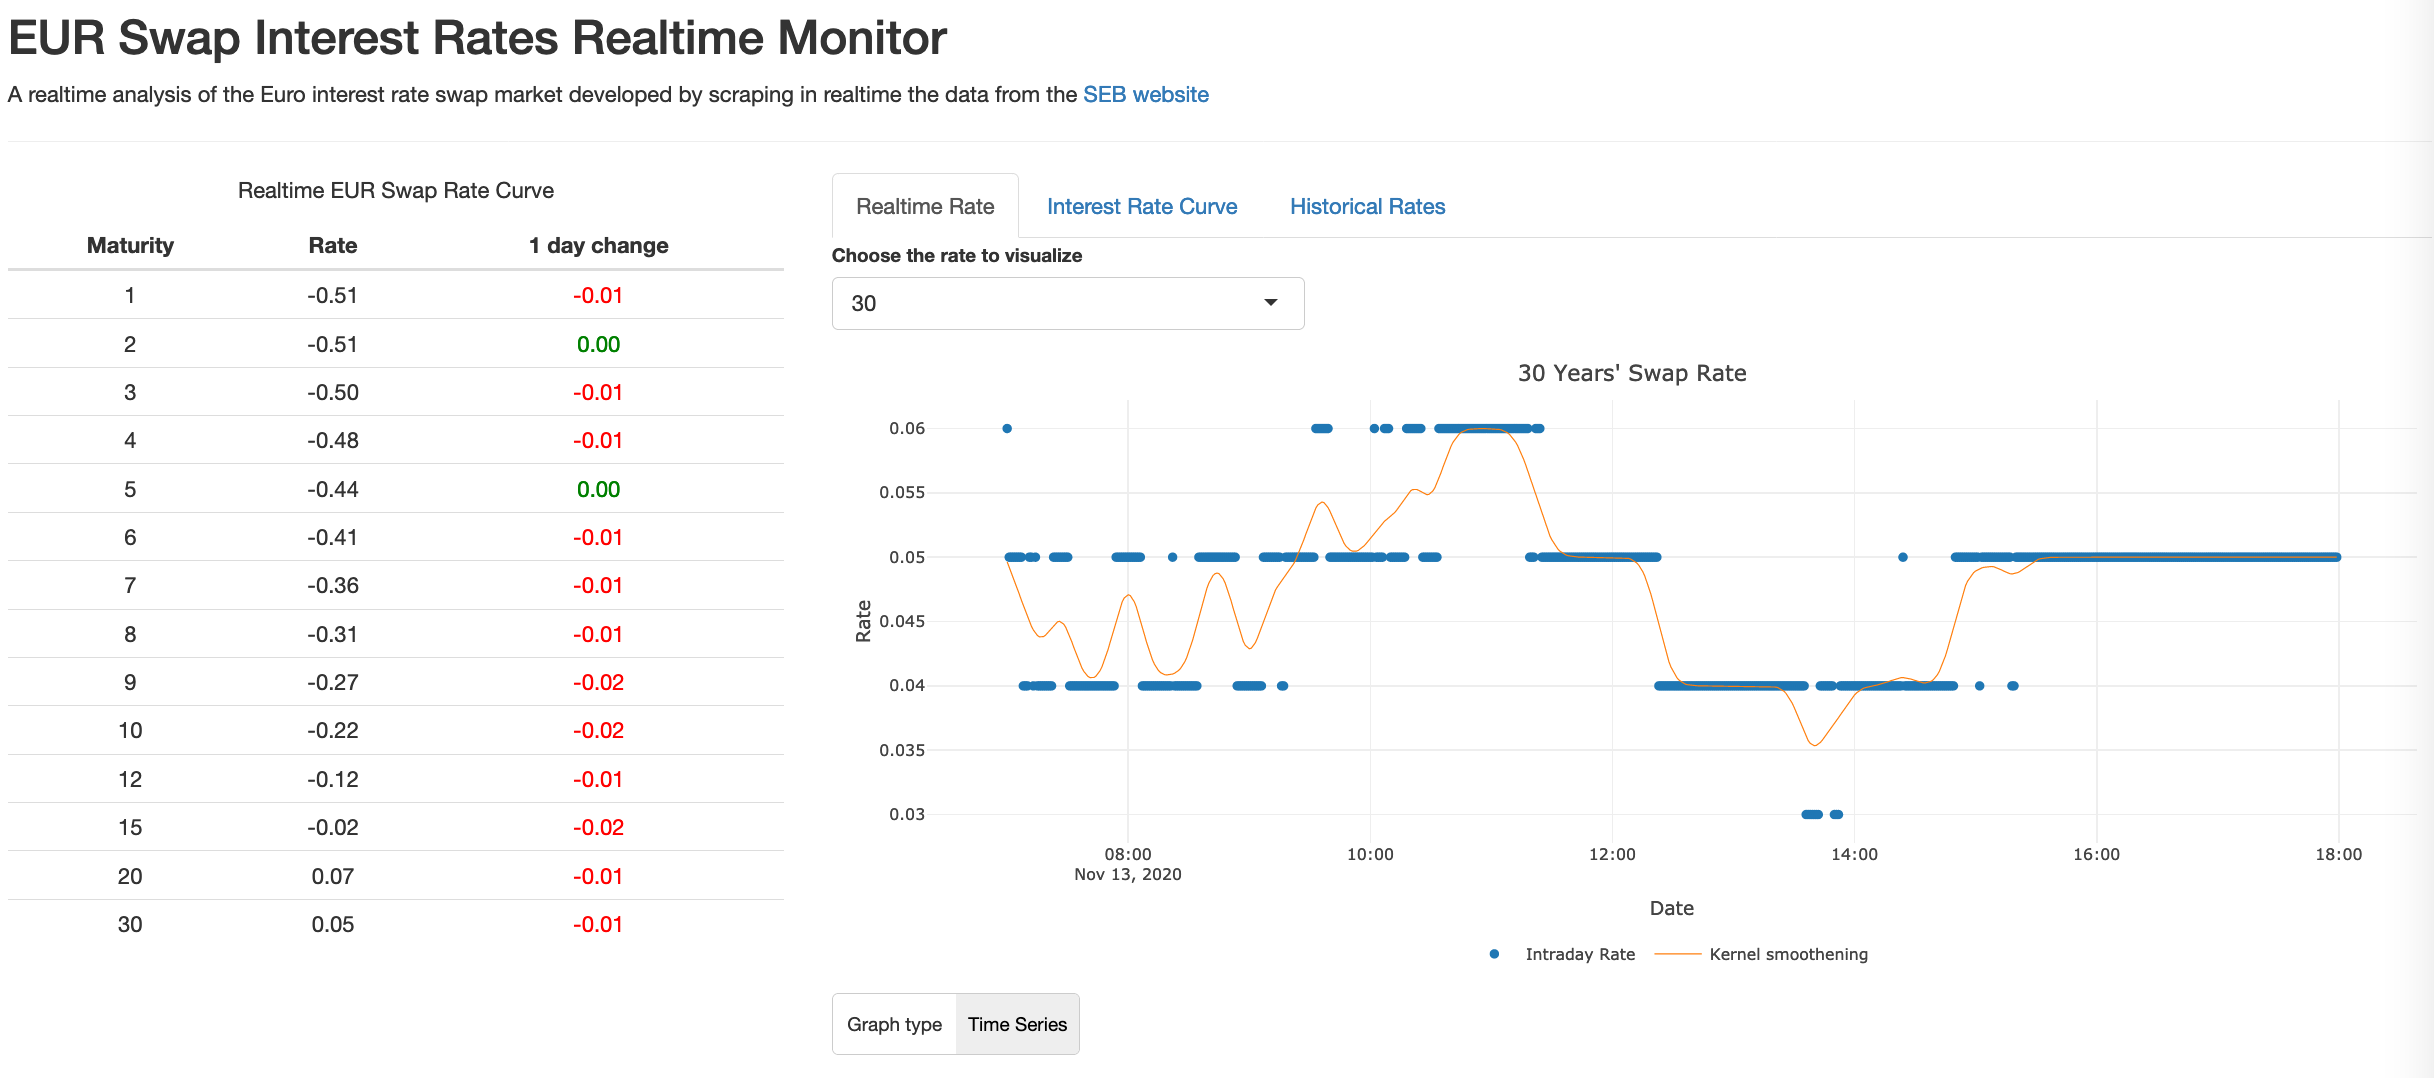
An online application developed using R shiny to monitor in realtime the change in the the Interest Rate Swap market by scraping the web. Source data is automatically scraped from a third party website .
Interactive Dashboard on Covid19 data in Italy
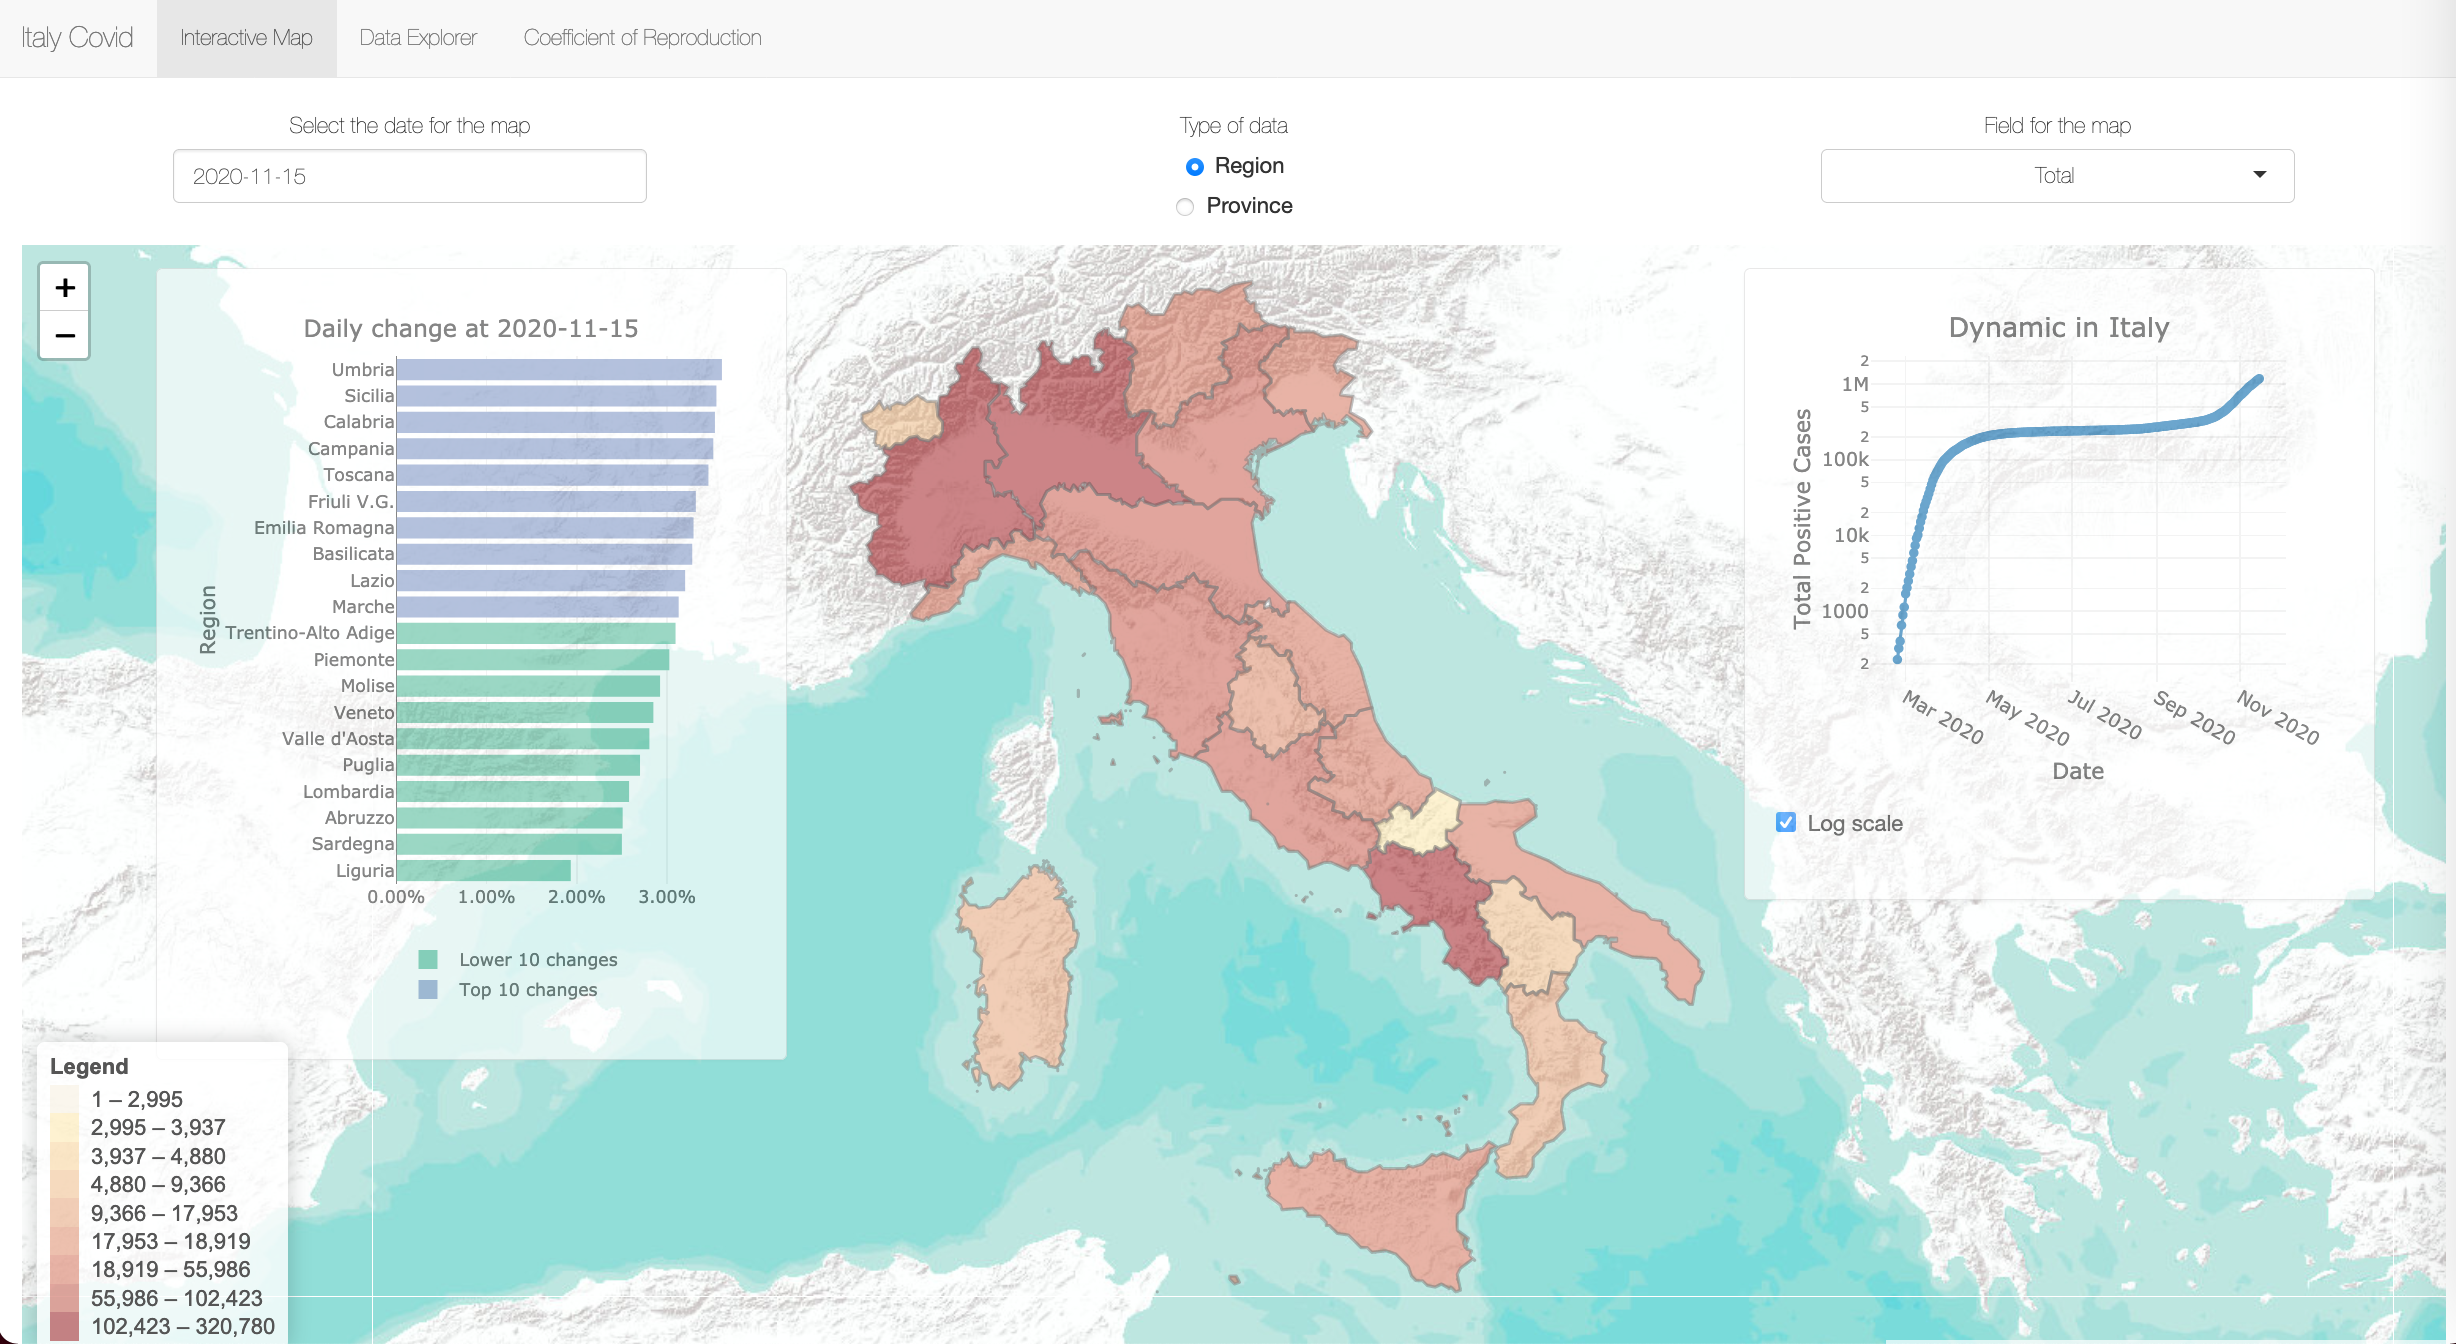
An interactive dashboard to track the evolution of the Covid19 contagion in Italy. Data is automatically sourced from the official Italian Government Covid Data repository (https://github.com/pcm-dpc/COVID-19) on a daily basis. The data reported in the dashboard is fully dependant on the original source and no additional post-processing is applied to the raw data by the author of the Dashboard.
Interactive Dashboard on Covid19 data in Ireland
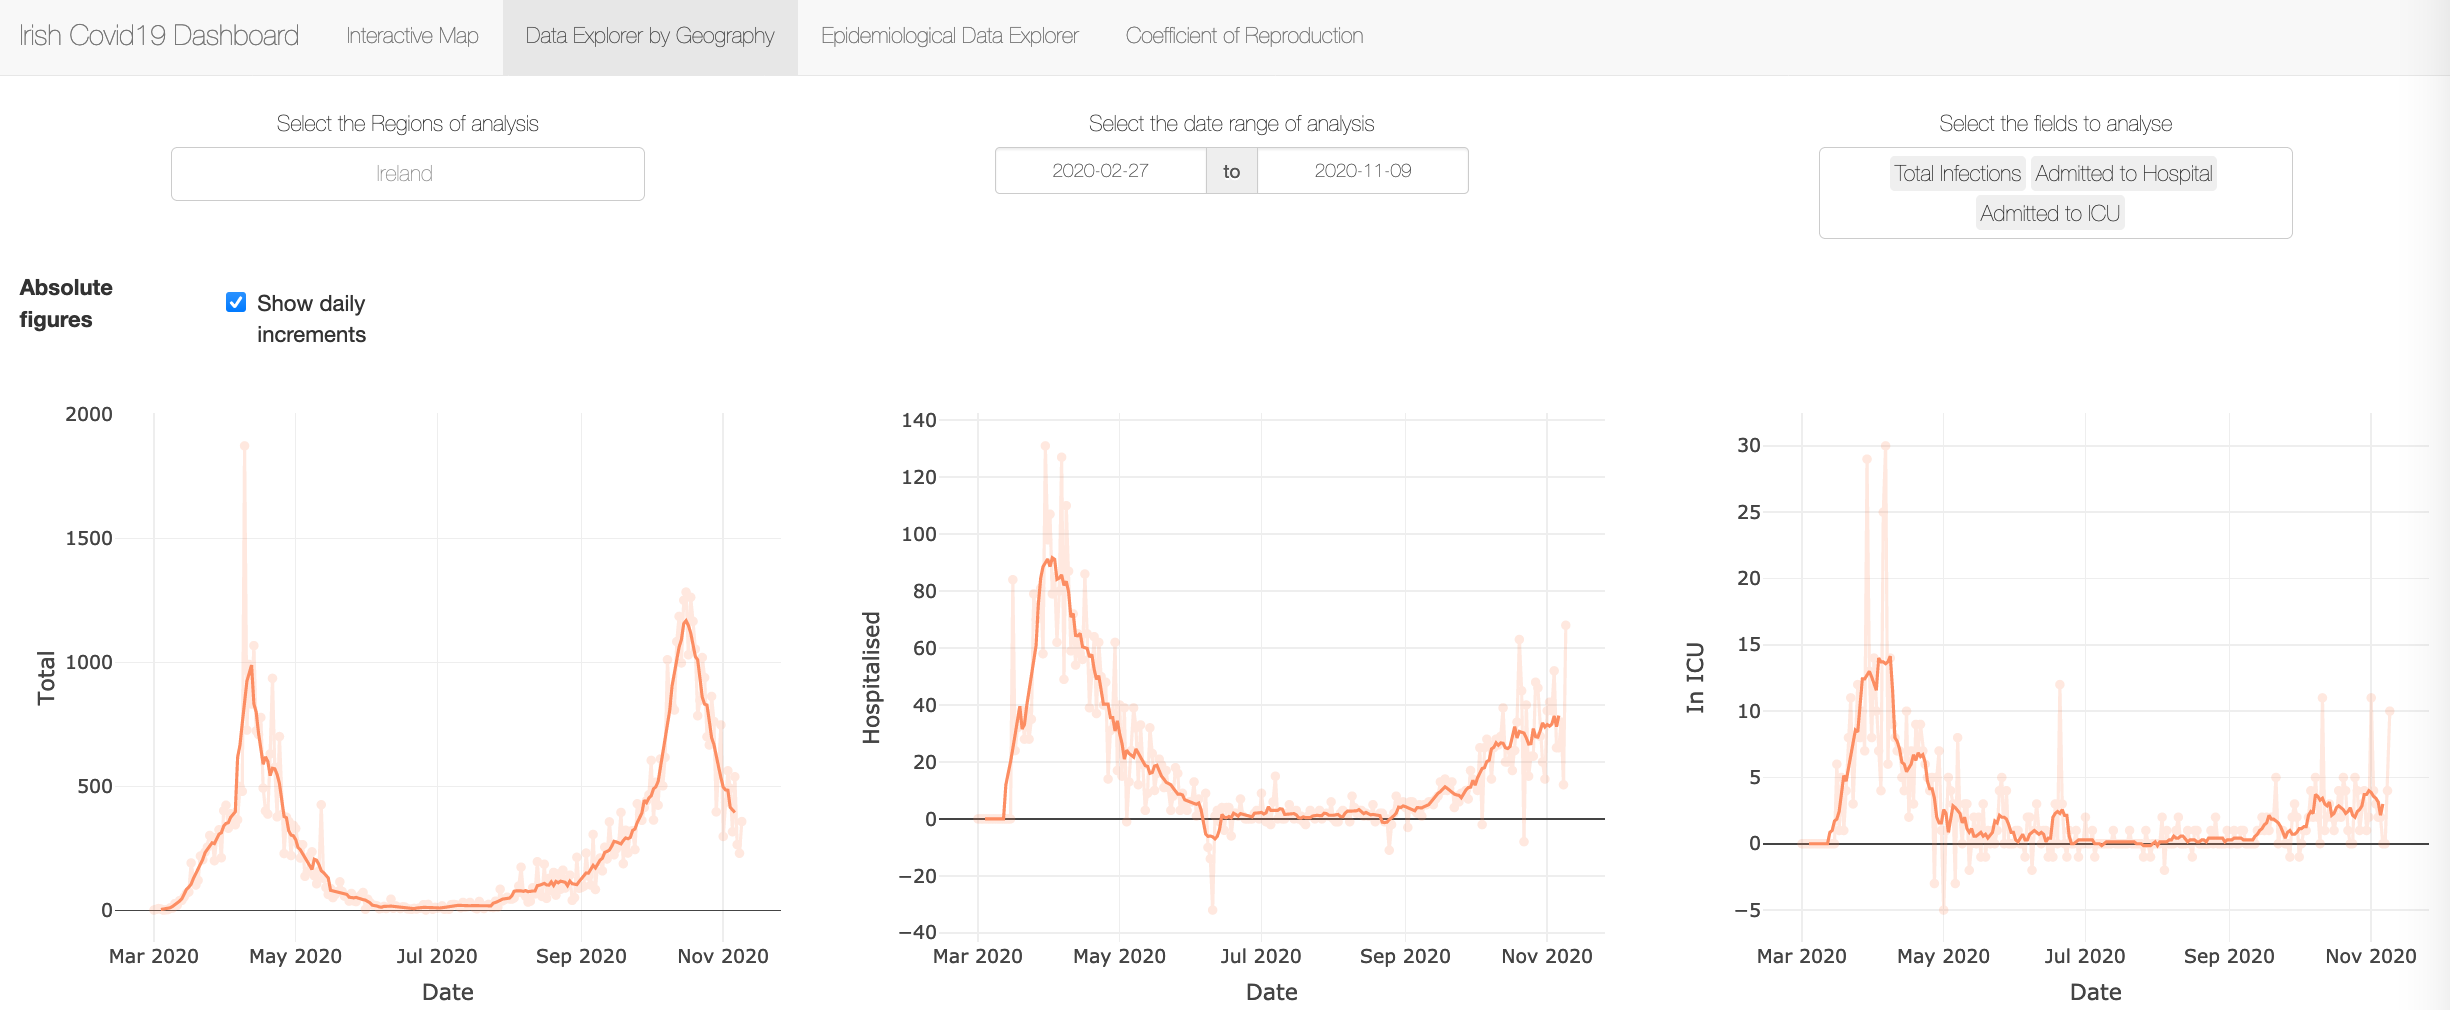
An interactive dashboard to track the evolution of the Covid19 contagion in Ireland. Data is sourced both from the Irish Government open data website (https://data.gov.ie/blog/coronavirus-covid-19) and by scraping the epidemiological pdf reports published by the Health Protection Surveillance Centre (https://www.hpsc.ie/a-z/respiratory/coronavirus/novelcoronavirus/casesinireland/). The data reported in the dashboard is fully dependant on the original source and no additional post-processing is applied to the raw data by the author of the Dashboard.

